Trade Markets in 7 Days Like a Pro in 2023

In this article you’ll learn:
- How to setup all the tools to start trading
- What are the main things that move the markets
- Top strategies for 2021 to trade markets even if you’re a complete beginner
- How to understand stocks, cryptocurrencies, forex and commodities markets
- Lots of advanced tips, strategies and techniques
So if you want to build up that new skill to make money from home or anywhere else this year, you’ll love today’s guide.
Let’s get started.
Contents

Before you begin trading, you need to set up the proper tools and be familiar with how they work.
These tools can work with your laptop or even a smartphone and a fast internet connection.
In this section, we’re going to cover every aspect of the setup so you could start. Don’t worry this is a beginner-friendly setup so anyone could follow along.
The most important thing you need to setup is your broker and trading platform.
Your choice of broker can make or break your success in trading. This is where most of the capital you will use will be placed and you will need to consider the spread, speed of your brokers, trading costs, uptime (how many hours or minutes the broker server goes down) and platform ease of use to get the most out of your trades.
In choosing a broker, you need to take into account these points:
Spread
In simple terms, this is the difference between asset prices, yields or rates. The spread is the gap between the bid price and the ask price. This can be a big difference between making a profit or piling up losses. A high spread means there is a large difference between the bid and the ask price. The lower the spread, the closer your entry position will be to the current market price.
Spread is important for traders as lower spread means smaller costs for trading, less volatility and fewer prices move intensely. For beginners, selecting brokers with low spreads is the best choice.
 Here in this example you see that if you were to sell the market you would open the position at the price marked with red if you were to buy the market you would open your position with the blue line.
In order to turn your trade to profit you need to wait for a market move that reaches the opposite price (move more than the spread).
Trading Costs
Depending on your broker, each trade comes with a set of fees and commissions that you need to pay out for each trade made.
Often overlooked by most newbie investors, the cost of making a trade affects your profit intake. The lower the fees for commissions are, the more money you make. Typically, there are different pricing options available for brokers:
- Per-share – this is popular with brokers that are specifically built for day traders and large proprietary trading forms. You pay a variable amount (typically around $0.001 – $0.005) for every share you purchased.
- Per-trade – this is the most common commission structure across the entire industry. You simply pay a fixed amount per trade you make (often ranging from $7 – $10).
- Overnight fees – These are interest paid on the leverage you use on short-term trades that have been kept beyond the trading day. If your positions are kept past trading hours, it will be considered “overnighting” which will entail overnight fees.
For a small trade, the per-share model makes sense since you’ll be paying for fewer fees. Per-trade fees are better, especially for larger positions.
Always consider overnight-fees especially if they will become part of your trading strategy.
When evaluating broker cost, it’s important to also understand that cheaper commissions in their sales pitch or ad campaigns don’t automatically make it a better choice.
Some brokers are “market makers” that require a big order flow before they place your trades. Check if your broker has “direct market access” so that you can be flexible with your trades and the broker can fulfill your order immediately. If you’re broker doesn’t directly send your order to the market, they will take a small risk and need to compensate you from their end if the trade immediately goes in your favor. Think of it as they are selling you an asset without first owning it.
There are also a lot of brokers who will claim “0%” fees and commissions. While it looks good on paper, you will be surprised by the hidden and predatory fees they will charge – such as spreads, overnight fees, deposit and withdrawal fees.
Be careful and read the fees table of the brokerage platform you will choose. Sometimes, the “0% commission” marketing slogan is just a ploy.
Trading / Charting Platform
A good broker should have a comprehensive and stable charting platform that can help you visualize pricing movements and guide you in making trading decisions.
Charting platforms allow you to visualize fluctuations and seismic shifts in market value. This is something we’ll talk about in the technical analysis chapter.
Some brokers tend to offer limited charting functions so you might consider getting third-party charting software. I recommend Tradingview as it’s one of the most popular ones and you get tons of features for free. It works great from your web browser or as a mobile app.

Trading Markets and Strategy
Ideally, you would want your broker to have the capacity for lower spreads as explained earlier.
You would also want a platform that can allow you to make use of options. Option trading allows you to buy assets at future pre-determined prices – allowing you to manage risks. These will allow you to create more profit.
At the same time, choose brokers based on the asset type you plan to trade and purchase. Different brokers cater to different markets. A forex trader would have different needs from a stock or options trader.
Technical Support and Compliance
Do your due diligence and make sure your broker is regulated. Buying and trading via unregulated online brokers is dangerous and will guarantee that you’ll lose your money over scams and fraud. Legal brokers are obligated to protect your financial well-being.
At the same time, whatever strategy you may implement, you will require some technical assistance at some point in the future. Get a broker with quick response times and good customer support. There are stories of bad customer response time that led to huge losses so this is something you need to really consider.
Choosing the broker
Now that you know what goes into your decision making process, go and choose your broker.
There are literally hundreds of different brokers. You can go with a local broker or choose an international one.
In this guide, I have covered 2 popular brokers that I’ve used myself and I can personally recommend.
eToro
You’ve probably seen their ads on YouTube and on social media. They are one of the most popular platforms out there and for good measure. The platform is actually super beginner-friendly, easy-to-use and not as complicated as other ones available. It allows you to trade across stocks, forex, cryptocurrencies and even contract for differences or CFDs.
You can open a free account here.
You can also open a demo account with them and try it out before you start investing with your real money.

VantageFX
Another good broker is VantageFX which is a global forex and CFD broker. They have low forex fees and their non-trading fees are manageable as well. Opening an account takes 5 minutes and is super easy.
Since it is a more professional option and my personal favorite, I’ll give you bit more overview of this broker.
VantageFX offers a very high margin – a maximum of 500:1 margin for approved accounts which allows you to multiply the amount you can trade. If a Forex Trader has account leverage of 500:1 and they wish to use $1000 as margin, they will have exposure of $500,000 for their trade value.
They are Australian based – funds are held in an account with Australia’s AA rated National Australia Bank (NAB).
On the flip side, the product portfolio at Vantage FX is rather limited however they give you everything a beginner investor would ever need from forex and cryptocurrencies to popular stocks and precious metals.
Vantage FX client portal is very easy to use, well-structured and features a set of convenient research tools. There are ample trading ideas, and news flows. In addition to an unlimited demo account, Vantage FX offers great video tutorials on various assets.
They release daily webinars where their pro analysts share their successful trades which could be a good way to start learning and understanding the thinking process of how pros trade.

Do note that VantageFX is only a broker and they don’t have their own trading interface where you actually place the trades. An industry standard for brokers like these is to use and setup MetaTrader (no sweat it’s totally free).
Download and Install the “MetaTrader 5” (or 4 depends on which account you created with Vantage. There’s no huge difference) app on the Appstore (for Apple users) or Google Playstore (for Android users).
Here are the links:
After installing the app, run the application by tapping the icon on your device.
This will lead you to the demo screen with different assets.
If you go to setting and tap on your account you’ll have the option to add additional accounts.
Setting up the account
If you already set up a VantageFX account previously you’ll have the login details on your email. If you created more than one account you can add all of them to your app. It’s suggested that you open a demo account first and try the platform without any risk and learn to navigate around the app first.
Once you have added your real account and demo account then you can simply switch between them and place trades comfortable on the go.
You can also create the account from MetaTrader app directly, but I recommend you create the account first on Vantage FX homepage and get the login details via email (maybe I’m just old school..).
The entire interface of the MetaTrader 5 mobile platform consists of the following:
- Quotes show you info on real-time prices of assets
- Chart provides price charts and technical analysis options
- Trade allows you to manage trade positions and pending orders
- History displays your trading history logged in the account
- Settings allow you manage application settings and switch between accounts
There you have it!
Once you’ve chosen your broker and have set up your account, you are off to a good start!
It’s time to learn more about price fluctuations and market value. These are important indicators that will dictate how you approach your trades.
Understanding how prices move up or down is one of the most important aspects of successful trading.
Markets will always go up or down. Your goal as a trader is to understand where the market is heading and trade in that direction. Simply put – buy low then sell it high.
In this section we’re going to cover how you can evaluate markets and get a better understanding of why markets move in certain ways.
If market trends up and increases over time, it is usually called a “bull” market. Downtrends or declining prices within a period of time is called a “bear” market.
TV pundits would often stress the importance of buying assets within bull markets and selling them off before we go into a bear one. But any successful trader would argue that market fluctuations go deeper than that.
It doesn’t really matter where the market is moving so long as you have a good understanding of how it fluctuates and changes.
Different factors come into play that dictates how prices and market values are on a daily, weekly or monthly basis. At the same time, each market would be influenced by totally different economics. Changes in prices in the stock market are not usually the same as the commodities and forex markets.
Let’s say that the US economy grows better than expected and it was reported that trade rapidly expanded this year. The forex market will show that currencies valued against the USD such as the EUR or JPY are expected to go down as the USD gains strength.
In the stock market, a better outlook for the US economy usually results in better stock performance and indexes growth. Commodity markets will likely report a decline in Gold and Silver prices as investors switch to dollars (USD).
If you want to generate a huge profit, you need to understand how market fluctuations work, why prices catapult then decline or how news and psychology affect the overall performance of your trades.
What is Market Fluctuation?
To get a grasp of how market prices are affected, you first need to understand what the market is.

Essentially, the market is a combination of different securities sold on an exchange where people can trade values.
For instance, if you watch financial news or read up on stock market updates focused on a set of securities like the Dow or S&P 500, you are only pertaining to a very few large institutions or securities. In general, this represents the performance of the entire market as a whole. This is called an “index”.
These indexes are a group or set of very specific securities that give you a perspective of how the overall market trends. Each asset type will have its own – like the NASDAQ and S&P 500 for stocks, Dow Jones Commodity Index for commodity futures. This is called a general market fluctuation. Long term investors focus on this.
But note that changes in the index don’t necessarily give you an idea of how each individual stock, commodity or forex performed. Even if the index crashed today, it doesn’t mean that all prices have gone down.
For instance, traders during the recession of 2009 made huge profits even if the overall market sentiment is down. There is an individual market fluctuation that applies to each and every price. This is a specific market fluctuation. This is where traders should focus on.
How They Are Affected By Catalyst?
At the most basic level, individual market fluctuations are due to changes in supply and demand. In essence, supply is about the number of available shares / commodities /currency that can be bought and demand is the eagerness of someone to pay for it.
This is where the law of supply and demand comes in. If there are more sellers, prices go down as there are more products available. If there are more buyers than sellers, the price goes up as more money is chasing the same amount of goods.
Understanding the reasons why people would buy more or sell more at any given time is crucial. These are called “catalysts”.
A catalyst is an event that propels the value of an asset upwards or downwards.
It can be almost anything.
- Good catalyst events drive prices upwards like Higher quarterly earnings reports, breakthrough product innovation or company acquisitions/mergers that increase stock market value. For forex, it can be the release of the non-farm payroll report. A higher payroll figure is good for the U.S. economy which foreign exchange traders and investors used as a benchmark that triggers US dollar gains. At most, they are targeting a positive addition of at least 100,000 jobs per month to act as a catalyst.
- Bad catalyst events are sparked by negative outlooks like outbreaks of war that affect oil supply, natural disasters that disrupt commodity supply chains or even quantitative easing policies that affect the money supply.
Analyzing catalyst events and how they affect prices can help you make better trades and anticipate how the asset will perform.
Here is a quick snapshot of each type.
Stock market prices are usually driven by two factors – fundamental and technical. These can be affected by internal events happening within the company and external changes within the company’s performance.
Fundamental factors push stock prices based on a company’s revenues and profitability from production or services it offers.
Example – Apple Inc reporting higher earnings from new iPhone sales or Facebook acquiring Instagram
Technical factors relate to a stock’s price history in the market pertaining to pattern and behavioral factors of traders and investors.
Examples of these indicators include – Price trends, Chart patterns, Moving averages, Support and resistance levels
The majority of the currencies are bought and sold based on flexible exchange rates that fluctuate based on supply and demand in the FOREX market. Increased demand for certain currencies will affect availability and result in a shortage that will drive prices. Decreased demand will lower the price. Certain factors affect this currency availability.
Monetary Policy – How central banks attempt to control demand for currencies by increasing or decreasing the money supply and/or benchmark interest rates.
Simplified Example – Central banks lower the interest rates. With low interest rates, people and businesses are more willing and able to borrow money. With more money being borrowed and spent, the money supply increases. If left uncontrolled, the value of the currency decreases and becomes weaker.
Inflation Rates – This has a huge bearing on the rate of currencies. The inflation rate is defined as the rate by which all prices of goods and services are increasing. The low inflation rate for the year – indicates that there is good economic growth and currency values are relatively stable. High inflation rates indicate that the economy is becoming unstable, leading to depreciation and a decline in the value of a currency.
Simplified Example – Venezuela’s currency is now basically worthless given the massive printing of money. In 2018 alone, Inflation has reached 80,000% per year resulting in an exchange of 4 million bolivars to one dollar.
The political and macroeconomic environment – Countries that are politically stable and have a strong economy usually have a higher demand, which results in higher exchange rates. The political climate will have an impact on a currency’s value. If a country is in the middle of a war or tension, the currency becomes less attractive for use and demand for it falls.
Example – Brexit has resulted in affecting the British Pound prices against the Euro and Dollar. The negative outlook on the UK exits from Europe weakened the demand for the currency as they switched their holdings to the safer Euro.
Commodity markets can be extremely volatile and unpredictable even for experienced and informed traders. Like other assets, prices are dictated by supply and demand. Understanding how demand for commodities change is the key.
Contract Futures – In commodities, prices are usually dictated by the futures or obligations of a buyer to purchase an asset for a predetermined price and date. These are contracts that allow any investor to speculate whether a commodity will increase or decrease in value. Often, they are used to hedge risks in prices and prevent losses but catalyst events can disrupt these agreements.
Simplified Example – Oil futures, which were usually dictated by output had an anomaly on April 20 when they hit negative $40.32 – below zero. Due to the lack of demand brought on by the pandemic, the cost of storing oil became more expensive brought on by months of oversupply of oil and lockdowns affecting travel.
Investing in cryptocurrency can be lucrative, but is extremely risky. It’s very difficult to predict how prices change given low market capitalization, short trade history and not well-developed asset valuation models. The key here is understand the market sentiment to know when to buy, hold or sell.
Retailer/Merchant Acceptance – Growing acceptance from mainstream retailers and merchants indicate higher demand and adoption. This simply means that more people will use the currency and technology. Increased adoption for the asset will increase the demand and its prices.
Example – Back in 2014, a number of brand-name businesses like PayPal and Microsoft started adopting Bitcoin payments. This widespread adoption made Bitcoin more mainstream and allowed consumers to be comfortable in holding the cryptocurrency.
Excitement around blockchain
This is a new asset group and due to the low market capitalization any serious money going in or out of this market is likely going to fluctuate the prices a lot.
Example – In 2020, Ethereum became one of the best performing cryptocurrencies – gaining 261% since January the same year. According to analysts, the primary driver for Ethereum’s growth has been the enormous boom in decentralized finance (DeFi) networks being announced to be built using the technology of the Ethereum platform.
Human Psychology – Emotional sentiment by the market is a strong driving force behind cryptocurrency prices. A lot of times investors don’t even know much about the technology behind a crypto asset, but simply buy it because of the hype and excitement.
In general, avoid buying over-hyped investments. Instead look for buying opportunities on “red days” when asset prices are correcting downwards. Cryptocurrency assets tend to make big swings like 80% within weeks. If something is off-the-charts overbought it’s likely that a correction is waiting around the corner.
Example – Elon Musk the famous CEO for Tesla electric cars and SpaceX tweeted on his Twitter about a popular meme-based cryptocurrency Dogecoin.
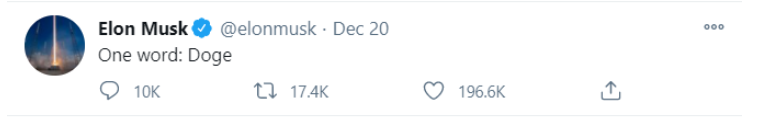 Result?

I know.
Such wow, very crypto.
Good trades and investments come with huge rewards, but here’s a reality check – they also carry a risk of loss.
Let’s explore these risks and learn how we can mitigate them so you could open trades with higher confidence.

Regardless of any investment – stocks, bonds, currencies, real estate can all lose their values. Even the most conservative securities like certificates of deposit come with inflationary risk.
In essence, risk is the possibility that your investments will negatively affect your returns and financial assets. It is the possibility that a negative financial outcome will occur. Most often than not – risk is related to reward.
Risk And Rewards
The risk that comes with a specific investment or asset class is correlated with the level of return that you will get from an investment. In short, lower risk leads to lower returns. Higher risk leads to higher rewards. The principle behind this is that investors are willing to take on riskier investments and lose their hard-earned money if the rewards are worth it.
Historically, those that have enjoyed the most volatile investments have yielded the most returns. For instance, a $100 investment into Bitcoin in 2010 would have yielded to $6.25 million today.
Do note though that these are anomalies in the modern investment world. Investing in early-stage start-ups or new developing asset classes can have the potential to multiply in value but it’s highly unlikely that we see another “Bitcoin” like investment with that much growth.
Stocks have returned an average annual return of over 10% per year over the long term. Compare that to safe investments like treasury bonds (5.5% per year), short-term treasury bills (3.5% per year) or even savings accounts that have yielded 1% or less.
Types Of Investment And Their Risk/Reward Ratio
Speculative assets
Cryptocurrency, Art, Venture Capital, Small market cap companies
Growth assets
Growth stocks and equity partnerships
Balanced assets
Large market cap and conservative stocks, municipal bonds and government notes, corporate bonds, Real estate investments, mutual funds, annuities
Safe assets
Savings, T-Bills, Money-market accounts
While this is the general rule, even the safest assets deemed “low risk” are actually prone to “high inflationary risk” and low to zero rewards in some countries with negative interest rates.
In Japan and the EU, the central bank is technically punishing savers and those who hold on to their safe assets with negative rates so you are basically paying your banks to hold your money and inflation eating away at your spending power each year.
So my personal take on the latter is actually moderate risk and low to zero reward.
Speculative assets do generate the most returns in the shortest amount of time. But they carry lower market capitalization, have less price movement history and carry the highest risk of failure. If you are comfortable with too much risk, speculative assets are the one for you.
These types of investments are usually recommended for younger people who can easily recover from these over time. As you grow older and your investment portfolio grows, you should skew towards more conservative investments.
Unless you’re Warren Buffet…
Different Types of Risk
Aside from knowing how risk equates to reward, you also need to understand what risks you’ll face as a trader.

There are generally 3 categories.
Market Risks
These are external conditions that you cannot control or change.
Marketability risk: This factor relates to the liquidity of your investments. For most traders, this will not be an issue but if you choose to invest in unlisted or private stocks/bonds/businesses, you risk the ability to be flexible in closing your positions in a timely matter.
Inflation risk: The return of your investment will not exceed the increases in costs that inflation causes. As basic costs like housing, clothing, medical and food — increase in price each year, investments that don’t keep up with inflation will actually end up losing money.
Currency exchange risk: Disparities in currencies especially when trading stocks of companies or commodities in foreign countries carry risk. Fluctuations between the values of your local currency and the currency in the country where you are trading will affect your net profit.
If the value of your currency rises against the other currency, your investment can be worth less when you convert it back. However, if you are just speculating with stocks CFDs, this shouldn’t be an issue since you don’t own the underlying stock but just the contract to acquire the security. A CFD acts as a hedge against this risk.
Investment risks
These are risks that relate to how you invest your money and manage trades – entries and exits. There are two types of risk that you need to pay attention to as it will affect volatility.
Concentration risk: This happens when you focus too much. Putting too many eggs in one basket and not diversifying ties your capital to the performance of that asset. By concentrating so much of your money on that one investment, you also concentrate the risks tied with that investment and the possibility of losing everything.
The problem with most traders is that they treat trading as a casino game. While betting all your money can provide you with huge returns when you get them right, you’ll lose everything when you get it wrong.
Like a game of poker, going all-in is a bluff gone wrong that will get you out of the game permanently. Don’t be blinded by the promise of getting rich quickly and take in substantial amounts of risk without learning how the market works.

Smart traders can manage concentration risk by understanding that there are winning and losing trades and being consistent with a trading strategy.
Opportunity risk: This type of risk is about balancing trade-offs between investments and trades. When you execute a trade, you create a position that locks up money that could have been otherwise used elsewhere or invested in another vehicle.
This will make you lose the opportunity to buy another position that could have been more beneficial to you. You need to weigh the opportunity cost against the benefit.
Trading risks
These are risks that are related to your trades. These are often related to increasing volume and speed of your trades. Day traders and swing traders can feel this burden as they allocate their money.
Gap risk: This type of risk occurs whenever you take a break in trading. Often, a stock opens at a price lower or higher than it previously closed. Often, a stock trades through your exit price.
For example, a stock may close at $10 a share today but open tomorrow morning at $5. If you planned to exit at $8 and have a stop order, your order will most likely happen at the opening price of $5 – effectively worsening your position. Price gaps that developed this way often occur at the open of the market.
It does rarely happen during the trading day when the market is suddenly placed on a circuit breaker – or for any other reason the trading halts.
Slippage risk: Slippage results from the hidden and predatory costs associated with every transaction you made for your trade. Every time you open and exit a position, your trading capital is also affected by a small amount of transaction fees.
The amounts for each trade may at first seem small between each position, but as your positions increase, so does the cost. You need to be aware of those changes.
Poor execution risk: This occurs when brokers have issues with filling your orders. This poor execution can come from fast trading conditions, limited stock availability of your bids and absence of other people in the market that you can transact with.
The implication of this is that what price you are expecting to get the trade is not what you actually get. By some degree, this will affect your trading strategy and ultimately your profits.
Mitigating Risks
Since your risk is synonymous with the reward, you need to be able to learn how to manage and tolerate it so you can make money. Here are some risk mitigating strategies you can implement on your trades to offset the potential risk involved.
Risk
Recommended strategy
Liquidity risk
Stick to listed and legitimate assets to beat liquidity risk
Liquidity risk happens when you are unable to exit when volatility hits the market. In a crashing market, this risk is greatly amplified. You can avoid this risk by ensuring that you only acquire assets that are listed and legitimate under brokers.
Inflation risk
Adjust your positions to manage inflation rate risk
Inflation risk is normally related to interest rates since high inflation comes from high interest rates. This impacts your positions.
The approach is to switch between equities, bonds and currencies to manage inflationary risk. When interest rates are cut, bond prices tend to go up. For equities, cutting interest rates means higher valuations. For currencies, higher interest rates weaken them which will make sense to shift away from them unless you are shorting them.
Currency exchange risk
Hedge your portfolio against currency risk
Currency risk spills over to your returns. When you develop your portfolio, you can manage risk by offsetting investments in both USD and your home country currency. You can also mitigate this if you hold CFDs as mentioned earlier.
Concentration risk
Diversify to limit concentration risk
The solution to concentration risk is diversification. Don’t invest more than 5% in any position. As much as possible, limit each position to just 1% of your total holdings.
Opportunity risk
Manage opportunity risk by analyzing returns
The solution is to set targets on where you will cut your losses or take profits. This forces traders to think through their trades and rationalize them. It also gives you an idea of how much money you will potentially lose and how much reward you can get.
Gap risk
Close the gap risk by keeping an eye on when to close trades
Gap risk can be mitigated by exiting positions at the end of the trading day and by executing stop-loss orders on after-market trading platforms.
Slippage risk
Choose the right broker and trading platform to reduce poor execution risk
Ensure your broker is right for frequent trading. Some brokers cater to customers who trade infrequently and for long-term investors. They charge high commissions, don’t offer the right analytical tools for active traders and have limited trading capabilities. Poor execution is usually a result of a bad broker and trading platform choices.
Poor execution risk
To help eliminate or reduce slippage risk, use limit orders instead of market orders
Unlike a market order, a limit order will only fill at the price you want and it won’t fill at a worse price. By using a limit order you avoid slippage. The only concern with limit orders is that it only works if the stock reaches the limit you set.
Still with me?
Great!
Now that you know the risks and rewards associated with trading and how to manage them, it’s time to start learning how to execute your trades and implementing a trading strategy.
Trade consists of buy and sell orders between two or more parties.
Simply put, if you want to buy an asset with $100, there has to be one or enough sellers who are willing to sell the asset for $100 in order for the trade to get executed.
Traders have a wide range of order types that they use and in various combinations to increase profits and minimize risk.
An order can be classified as either a buy order or a sell order.
For instance, a trader can place a buy order to enter a trade with the expectation that the price will increase. If it does they have the opportunity to close it with a profit or if they expect the price to increase even further they can wait and close it even with larger profit.
You also place a sell order that will mark your exit in a position – this is frequently referenced to short selling or just shorting. You enter a sell position when you expect the price to decrease. If it does – you’re making a profit.
Trading Spot Market Prices
Spot market orders are buying or selling at current prices – whatever amount it costs. In active markets, the orders are usually executed immediately, but often they are not at the exact price you are expecting.
There are cases of price changes in between ordering stocks. For example, you may buy a stock at $100 but if enough shares are being traded at the exact same time, the price might have increased to $100.10 by the time you placed an order and it was executed. This is where slippage risk occurs.
You only use spot market prices when you want to process orders as quickly as possible and you are open to slippage risk and getting a different price.
Setting Stop Loss
To minimize risk on your trades, you need to craft an exit strategy.

When your trades don’t work out the way you want them to, a stop-loss order will cut the bleeding. A stop loss is a risk mitigation order that occurs when you exit a trade once a certain price level is reached.
For example, you bought a stock at $50 and placed a stop-loss order at $49. Your stop-loss order will execute once a price comes down to $49, thereby ensuring that you avoid any further loss (as we assume that the price keeps falling further).
If the price never falls below that threshold, your stop loss order will never be executed.
Note that stop-loss orders are “market orders” – it takes whatever price is available once a price touches the amount you set regardless if it’s a bid, ask or last price. This means that even you set your stop loss at $49 the actual execution price is likely a bit different.
Limit Buy Orders
A limit buy order is another type of order frequently used to get in the market at a more favorable time.
If the price of an asset meets your target price, a limit order will be instantly sent by your broker to finalize a position at a price you entered or a price that is even better.
Unlike the stop loss order that closes the trade at any price so long it meets your minimum threshold, the limit buy order will only go ahead at the marked price or better. This minimizes slippage but it creates a bigger issue – it won’t release you from a position especially when the price is moving wildly against the direction you intend it to go.
Limit buy order is useful if you’re tracking an asset and you’re looking for key entry prices.
Since markets are traded mostly by humans or robots that are programmed by humans, then we can say that a lot of times investors are looking for these big even levels. For example Bitcoin $20,000, Tesla $500, Dow Jones $30,000 are some that would have historically confirmed the trend and would have been sweet entry points.
Some tips to consider.
When Buying – you shouldn’t buy it at any random price point. Have a little bit of leeway between your target price and your order price, so you have the opportunity for price fluctuation and it will still enable you to close a position should it go against you. One way to do this is by buying your orders to put them below a “swing low”. This happens when the price falls a little bit then rebounds – indicating that a price level you are targeting found support from other people buying the asset.
The key here is to just execute a trade that follows the same trajectory that the market is doing.
When shorting or selling – Similar to buying, don’t implement this order at a random price point. Give the market some wiggle room by implementing a stop-loss order just above a “swing high”. A swing high means that a price trajectory will rise then fall flat. This shows that there is resistance at the upper price level and the trends is likely going to reverse.
You want to trade in the direction of the new forming trend so aim for placing a position so long as the price is starting to move down.
Trading with Margin
Margin is a great way to maximize leverage and improve your position even without cash on hand.
It enhances your buying power by granting you access to a larger amount of capital without necessarily having it in your account. The shortfall will be fulfilled by your broker provided you will cover the interest.
Do note that trading on margin multiplies your risk by twofold, tenfold or even a hundredfold. While the potential rewards are higher, it is also highly speculative. You should only attempt margin trading if you are completely comfortable with the amount of potential losses that can incur and learn to mitigate their risk as much as possible.
Hands-Off Approach
How to Manage Trades Without Stressing Over Prices?
Most traders are glued to their trading platforms – worrying about price changes and when to execute their orders.

The good news is that you can and often times should manage your trades by having a hands-off approach. You can do this by placing an order with a stop loss and take profit targets. This means that you automate your trade – take profit at a certain target or cut losses when it reaches your stop-loss price.
These stop-losses and targets offset each order to manage losses with a reasonable amount and make an exit once it meets your profit conditions. With this approach, the only thing you need to do is to wait.
The price will either hit your target or meet a stop loss requirement. If you’re analyzing the market and following the fundamental and technical analysis you should be taking more profits than losses.
With this strategy, you only change or adjust your position if there is a catalyst that will likely affect your positions significantly.
Since you are familiar with the basics of trading, it’s time for you to learn more about analyzing your trades. In the next 2 days, you’ll be more familiar with fundamental and technical analysis.
Fundamental analysis is a bit like taking a few steps back and looking at things from a macro-economic perspective.
We don’t focus heavily on a daily price fluctuation or technical indicators, but rather try to get the market sentiment, trends and look into the company and people who influence the asset price.

The intent in fundamental analysis is to arrive at a price that the investor can ascertain and compare with how the market values an asset. In simple terms, your goal is to find assets that the market finds overvalued or undervalued to attempt to build a position before it corrects itself.
Quantitative and Qualitative Fundamental Analysis
In assessing the fundamentals of a company, there are various factors involved from the company’s revenue and profit down to how management is operating. These factors can be classified into these two:
Quantitative – these are factors related to financial performance and the numbers associated with the deal.
Some key things you need to consider.
- Do you expect the company (or asset) to generate consistent revenue or value over the next few months or year?
- What are their operating costs and how does this cost influence their business? Are these costs stable or expected to rise?
- Does the company have enough assets to pay for its debts or services? In case of start-ups you might also want to see how long is their runway?
- What is the trading volume of the asset? Is showing an uptrend or a downtrend?
Qualitative – these are less tangible factors that affect how the asset is valued.
Some basic things you may need to consider.
- Does the asset or the company have a unique feature or monopoly over a certain product that other companies cannot replicate?
- Does it have proprietary technology or patents?
- Does it have brand-name recognition?
- Do they have the top-ranked quality executives?
Most fundamentalists analyze both to arrive at an intrinsic value. Properly ascertaining the intrinsic value of an investment will help find opportunities to buy at a discount or avoid overvalued investments.
Now, before you go ahead and take that MBA program to learn how to read balance sheets and financial reports there’s an easier way. Read what other smart people with track-record have concluded.
Some good financial reading sources
Reading financial news allows you to determine qualitative or quantitative updates that can help influence market values. Here are some websites where I usually get my financial news.
- Bloomberg Business – one of the leading business and market news sites. They also offer data and analysis on their business columns. A great read if you want to get up-to-date on all business related news.
- MarketWatch – tracks the overall sentiment of the market. It’s one of the leaders in personal finance and market information – offering real-time data and commentary.
- ForexFactory – designed as a hub for professional and amateur traders alike, it will help give you insight on the forex market. From news to forums, it can give you an amazing perspective on the movement of currency baskets and how you can profit from their changes.
- Cointelegraph and Coindesk – cover everything major that goes on in the cryptocurrency niche, from market analysis to news about new projects and what’s the market sentiment around Bitcoin and other cryptocurrencies can be found there.
One key thing to remember here is that not all news sources are created equal. It’s better to remember these guidelines as you review the news that you read online.
Respect Whatever Data Comes Your Way – when reviewing commentary, it should always be backed by data (like this article here 👌) and supporting information. Don’t assume that something is a fact without factual data that can support it.
Check consensus – if there is an overwhelming sentiment against a certain news item or fact, then it might shake the asset price. Depends on how big is the news and how viral it is.
Question the narrative – narratives are often misleading, incomplete or flat-out wrong. Make sure you do proper due diligence by verifying information on public documents or reviewing actual quotes or opinions of others.
Headlines are made for clicks not to reflect the truth.
Be open to disagreements – by understanding the other side of the argument, you can make a better decision. Most often than not, we fall into confirmation bias. Listening to contrarian opinions allows us to question our own assumptions and make better business decisions.
Now you have a basic understanding of fundamental analysis. Fundamental analysts believe the market often overlooks the real value of an asset. Fundamental analysts will pay less attention to chart trends and patterns in favor of unearthing the balance sheet and the market profile of an asset in search of intrinsic value not currently reflected in the market price.
However trade chart patterns can also tell the story of how markets are moving and what is the sentiment. In the next day, we’ll discuss how this is shown in technical analysis.
This is where we analyze the historical market data to predict where the price is going in the future.
In this chapter I want to focus on 3 key technical indicators that are definitely enough for beginner traders.

Technical analysis (often referred to as TA by traders) involves a series of strategies that depend on interpreting the price action in an asset.
There’s a popular saying.
History tends to repeat itself.
This can’t be any more true with technical trading. Most of the technical indicators are based on the past and they can predict the future price moves pretty accurately.
There are different indicators for different purposes. To track trends, overbought and oversold areas, trading volume, etc.
The amount of different indicators and what indicators a trader uses is a matter of preference. A lot of times it’s recommended not to use too many technical indicators as it complicates the big picture and gives you more wrong signals than right signals.
Understanding Candlestick Charts
If you’re new to trading you’ve probably haven’t used candlestick charts before and maybe have only seen the price movements on a regular line chart.
That’s okay, I’ll give you a brief explanation of what candlestick charts are and why these are frequently used over regular line chart.

Candlestick chart usually consists of two colored rectangles (candles) with sticks pointing out from either the upper and/or lower end of the box. These rectangles represent the price movement with a set time frame.
So for example you’re looking at the 1 hour price chart and you see a red candle with a small upper stick and a longer lower stick. This means that the price went overall down during this hour (compared to the previous candle). The upper stick shows that even though the price ended lower it visited higher price during this hour. The lower stick shows which was the lowest point where the price went during the hour.
Why traders look at candlestick charts instead of regular line charts?
The candlesticks and the shape they form over a longer period of time usually tell a story. They give a more visual overview of how violent was the push if candles are becoming shorter or longer compared to previous ones and so on.
Candlestick charts and patterns is a whole different topic, which we might cover in future posts, but if you’d like to learn more now, then check out Investopedia’s article about these patterns.
Using Technical Analysis
Markets move up and down. Technical traders, who are looking to trade the market look similar indicators and the same chart. This means that if enough traders are thinking the same thing about an asset and take the trade, the price starts to move.
Wouldn’t be awesome to read the indicators like they do and think like they do?
I personally like to view the technical analysis in two major sections.
Chart Patterns
This is a type of analysis that involves attempting to identify support and resistance on a chart by looking at specific price movements.
It is mostly subjective – understanding psychological factors to try to predict where prices are generally headed. This is more art than science.
Technical Indicators
This type of analysis requires an understanding of the statistics behind assets – applying mathematical formulas to prices and volumes. There are simple indicators like “moving averages” to more complex ones that includes the moving average convergence-divergence (MACD).
Most modern trading systems are based on technical indicators since they are reliant on methodical models.
Let’s look at some of the most common indicators used
Trend (moving averages)
Moving average is the simplest yet very common technical analysis tool.
Think of moving average lines as support and resistance levels which take into account the price movement of past periods. Based on past prices, it leads or lags behind. Leading indicators predict market movements while lagging indicators confirm trends that are already taking place.

For example, multiple moving averages can be applied to an asset chart to determine the trend and potential trend changes (breakouts). With moving averages these usually happen when one moving average crosses the other one.
Notice that number in the indicator label on the example. This reflects the period of price data is taken into consideration to draw the line. Longer time frames for moving averages results in greater lag. So, an 8-day moving average observes less lag than a 20-day MA or 90-day MA since it contains fewer data points.
When reading trends, the 8,20,90-day moving average are widely used as also 50,100,200-day. These give traders an understanding of the asset trend and when a potential trend reversal is happening.
Simple Moving Average
The simple moving average (SMA) is calculated by checking the arithmetic mean of a given set of values (asset price in our case). You add them together and then divide by the number of prices in the set.
This will give you an overall idea of the trends in a data set. When the trends are going upward, there is an indication of increasing prices and vice versa.
In addition to SMA, exponential moving average (EMA) is also often used as it’s more sensitive to bigger fluctuations on the market. This is shown also in the example above.
Overbought And Oversold Territories (RSI and Bollinger Bands)
Two of my favorite indicators to track if an asset is overbought or oversold are the Bollinger Bands and Relative Strength Index (RSI).
If something is overbought, it tends to start going down and if something is oversold it means traders are looking to start buying again.
Here’s an example of a Bollinger Bands in action. See, every time the price candles hit the upper or lower line of the bands the price start reversing.

And this goes on and on.
You see it’s not rocket science to open successful trades when you have these indicators at your disposal.
When using Bollinger Bands as your main indicator keep in mind these things.
- When the bands are tighter during a period of low volatility or change in pricing, it raises the chance that there will be a sharp price move in either direction. This can be an indicator of a trending move. When the bands widen by an unusually big amount, it indicates that volatility has increase and any existing trend is likely changing.
- Prices tend to juggle around the band’s envelope – moving between the upper and lower bands respectively. Make use of the “swings” to position yourself and help gauge your profit targets, stop-losses and exits. For instance, if the price bounces off a higher band and crosses below the moving average, it indicates that the lower band becomes the stop-loss target. Prices can exceed or stay within the band envelop during strong trends.
- Bollinger bands aren’t very accurate when you have a strong trending market. They work best when the market has lower volatility and moves sideways or has a weaker trend. As you see in the example the price is trending downwards and it would be a lot harder to catch buy entries. I would trade with moving averages until there’s a confirmation where moving averages cross to indicate the start of an upward trend.
It is common to make use of Bollinger bands with another indicator called the Relative Strength Index, or RSI.
The RSI, helps traders identify potentially good entry points (when an asset is oversold) and sell points (when an asset is overbought).

It indicates momentum comparing the number of days an asset closes upwards against closing down over time. These figures are then plotted on a range from zero to 100. Overbought assets are typically expected when the RSI returns a value over 70 and oversold assets are expected when the value is under 30.
As you see in the example, every time an asset reaches the overbought territory it tends to pull back. Once it reaches to the oversold area it retraces and start’s climbing again.
Key Price Points, Support And Resistance
In analyzing chart patterns, support and resistance are used by traders to refer to price levels on charts that tend to act as price reversal points. These prevent the price of an asset from getting pushed in a certain direction or trajectory.

Support is the price level where a downward trend is expected to hold due to huge demand or buying interest. If the price of an asset drops, demand for the assets further increases, thus forming the support line.
On the other hand, resistance zones arise due to sell off interest when prices have usually increased. Once this “zone” of support or resistance has been determined, those price levels can be potential entry or exit points.
As a price reaches a point of support or resistance, it will do one of either bounce back away from the support or resistance level or ignore the price level and continue in its direction until it hits another support or resistance level for a longer period.
This shows a constant price level prevents an asset’s price from moving higher or lower. The static barrier is one of the most popular forms of support/resistance. If the price of financial assets generally trends upward or downward, you can usually see these price barriers change over time.
When the market is trending upwards, resistance levels are formed as the price changes slow and start to inch back toward the trendline.
This happens when traders engage in profit-taking or a near-term uncertainty for a particular industry or asset. This results in a “plateau” effect – essentially dropping-off in an asset price.
You should always pay attention to the price of the asset if and when it falls toward the broader support of the trendline since this zone has prevented any price to go even lower.
The important thing to keep in mind. Both resistance and support levels tend to formulate on big evens price points like Bitcoin at $40k, Dow Jones at $30k, Gold at $2k and so on.
In addition a lot of times previous resistance tends to become support in an uptrend (see the example image above) and previous support tends to become resistance in a downtrend.
We have only scratched the tip of the iceberg. There’s definitely more to cover in technical trading, however I don’t want to completely overwhelm you. By following these 3 main indicator types you’re well set to place successful trades.
In the last chapter of this article we’re going to look at managing your capital and making sure you don’t lose what you make by not letting your emotions take control.
More than anything, success in trading is all about discipline and this goes back to how well you manage and handle your money.
It’s not just about how much you can make, but also how much you can keep.
Capital management is about determining your goals and how much you’re willing to put in each trade and how much losses you’re willing to take.
Without good capital management techniques, you won’t be staying in the trade for too long as your decisions will be based on emotions.
Trade with a demo account
If you are not ready to invest your money, try with a demo account. Almost all (if not all) brokers have demo account options available.

Both our recommended eToro and VantageFX offer demo accounts so before you start take a 30-day challenge and see if you can grow your demo money or will you blow up your account.
A more old school approach would be to simply do paper trades. This means you write down on your paper (or computer or phone) the trades you would have taken. Then you track these and either close with a profit or take losses based on how the market actually moves.
Be comfortable in closing your positions
The best form of money management is knowing when to call it quits.

Don’t let greed or emotions win the day. When you’re up on your positions and you have set a take profit level, then take the profit rather than expecting an even higher profit. You will never time the market tops or bottoms right so there’s no point even trying this.
The same goes for losses. If you see your trade going against your direction and you’re down on your money, don’t stress about it.
Firstly, acknowledge that you will not win all trades. Set stop loss level and if your trade hits that, then that’s the way it is. Remember it might also reverse before it hits that so don’t get emotional and close it before it hits that stop level.
Secondly, remember that you opened the trade based on your analysis and if you were wrong then you gained experience and you can make a better decision next time.
Implementing the Martingale strategy and 1% rule
The Martingale system is a simple money management system that is popular with traders (and gamblers). The rule is simple – start with a small amount per trade and double the amount if the trade is not going in your favor.

The idea behind probability. The more trades you open in one direction the more likely it will be that one of them turns a profit. And if you’ve been increasing the amount with every trade then the last winning trade will cover all the losses from previous open trades which you can comfortably close with a loss.
So let’s say you open trade when you see a potential trend reversal. The technical indicators are showing this and the fundamentals are supporting it, but the reversal isn’t happening yet. This is where you could open another trade with double or triple the amount (depends on how aggressive you want to be). The likelihood of trend reversal increases with every trade you make.
However this strategy requires quite deep pockets and very calm nerves as you could be in the red with big amounts quite fast. Try this with a demo account first and see if you feel comfortable with it or not.
From my own personal experience, I would avoid using this method with highly trending markets that are driven strongly by the news and fundamentals. The strategy works great for more conservative assets that move in a predictable way.
An iteration of this system is the 1% risk rule that career traders use to manage risk in their trading methods. This method is earmarking just 1% of your total account value in each trade. This means that you would need to lose in 100 consecutive trades in order to wipe your account. Losing 100 trades in a row is very difficult to achieve statistically speaking.
Takeaway
Trading stocks and other assets can feel intimidating – with your own money on the line, it can cause a lot of stress in the beginning. However if you apply what you learned from this article you’re already doing better than a lot of new traders.
The key is to understand how market prices fluctuate and how they are influenced by catalysts. Combining this fundamental analysis with technical indicators and chart patterns you can make an informed decision and have a high success rate with your trades.
Keep in mind that about 70-90% of all traders lose money. The reason is often related to them being too lazy or too impatient. These are the two things you need to work on. Always do your analysis and never let your emotions control you.
You need to take trading as a calm statistical activity. You will not succeed with all of your trades. It’s okay to lose trades. If you do your analysis and have a good risk and money management strategy in place you have more chances of succeeding with trading.
So what’s next?
- Find a suitable broker. If you like something simple we suggest eToro. If you’d like to start trying immediately how the pros do it (sooner or later you should), then create an account with our tested and recommended broker VantageFX.
- Get familiar with news sources and charting tool – Tradingview
- Trade at least 30 days with a demo account to get comfortable with the app user interface and try different strategies discussed in this article.
- Celebrate small wins and analyze and learn from your lost trades. It’s important to have fun and take this as not a get rich quick scheme, but rather as a new modern skill that you’re learning. Some of us pay more than others by losing trades. That’s okay, we learn more from unsuccessful trades than successful trades. So losing is actually a good thing.
- Start trading with real money. This is psychologically always difficult. The trick is to start small and only invest what you’re absolutely comfortable losing. Start even as low as $100 and trade with cents to get your feet wet.
If you’ve made it this far, I congratulate you. This has been a beast of a blog post. If you skimmed it through and rather would like to consume this in parts over email or maybe in a video format definitely let me know in the comments below.
If you’re already trading and you have some additional advice to share with other readers, please leave us your comments.
PS! If trading isn’t really your jam yet, then you might want to check out our guide to become an investor from being an employee.
PPSS! Don’t have a job yet? No problem, read our guide on how to land your dream job in marketing at any age.
PPSSSST! Or if you’re already in marketing and simply looking for more ways to make money online, then check out our guide to make money with Instagram.
(Full disclosure: some of the links on this website are affiliate links. I’d appreciate it if you use my link when making a purchase. I will get a small bonus from that, which will support this blog and help me create more content in the future).
Want to learn how I place trades automatically with close to 90% success rate?
Sign-up for my free newsletter and get these simple step-by-step instructions to your email.

0 Comments